This problem involves analyzing the limit of the approximating rectangles which tells us the area under a curve, and determining what the function is along with what interval we're measuring area under.
Here's the limit:
How do we find the function and the interval whose area is described by the above limit? Well, we know that the area of a rectangle is
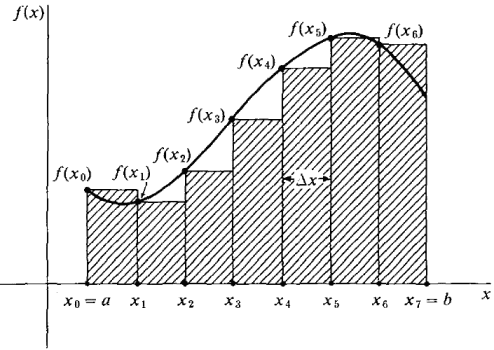
height * base -- so it follows that the area of an approximating rectangle under a curve is just the width of the interval * f(x) evaluated at the chosen endpoint/midpoint. Here's a graph to refresh your memory.
In this particular illustration, they are creating the approximating rectangles using the left endpoints. You can tell because the horizontal lines are being drawn from x = a which is the leftmost endpoint on the interval.
Also note that when a function is increasing over an interval, using left endpoints will underestimate the area under the curve. Using right endpoints will force an overestimate for the same function.
So the area of the first rectangle is b-a/7 (effectively the width of the rectangle) * f(Xa).
Back to the question:
Recall that this is a summation formula and if you look at the term outside the parentheses there is a term that will be distributed through the set of terms being influenced by the "i" in the limit. 2/n represents the width of the interval for each approximating rectangle. So this is the base of the rectangle. If you're wondering which rectangle remember this - 2/n is a constant proportion representing the area of any given rectangle. If we had 1000 rectangles that width would be 2/1000. Don't think of the width of the approximating rectangles as varying from rectangle to rectangle.
So b-a/n = 2/n. This means that the difference between b and a is 2. Without knowing anything else we could guess that the interval is 45 to 47, or 87 to 89. It's not right but at least the distance of the interval would be accurate. The area would be a bit high I'm afraid though.
So let's figure out what A and B are. The term in the parentheses represents the function evaluated at the Xi at the ith subinterval. It's 5 + 2*something/n. The 5 tells us something - it tells us that the interval begins at x = 5.
So a = 5, which means that if b - 5 = 2, b = 7.
Considering the term in the parentheses, it's simply describing the height of the approximating rectangle at the ith subinterval in a generalized way. As the term 2/n is just describing the interval in a generalized way.
Monday, April 7, 2008
Area Under a Curve as Limit - Find The Function
Professional Calculus 1 and 2 Study DVDs.
Labels:
area as a limit,
area under curve,
find the function
Subscribe to:
Post Comments (Atom)

No comments:
Post a Comment